
科研
Last updated: 2026-07-27
For a complete list of publications, please see my Google Scholar profile.
1. Mass Spectrometry Imaging
1.1 Introduction
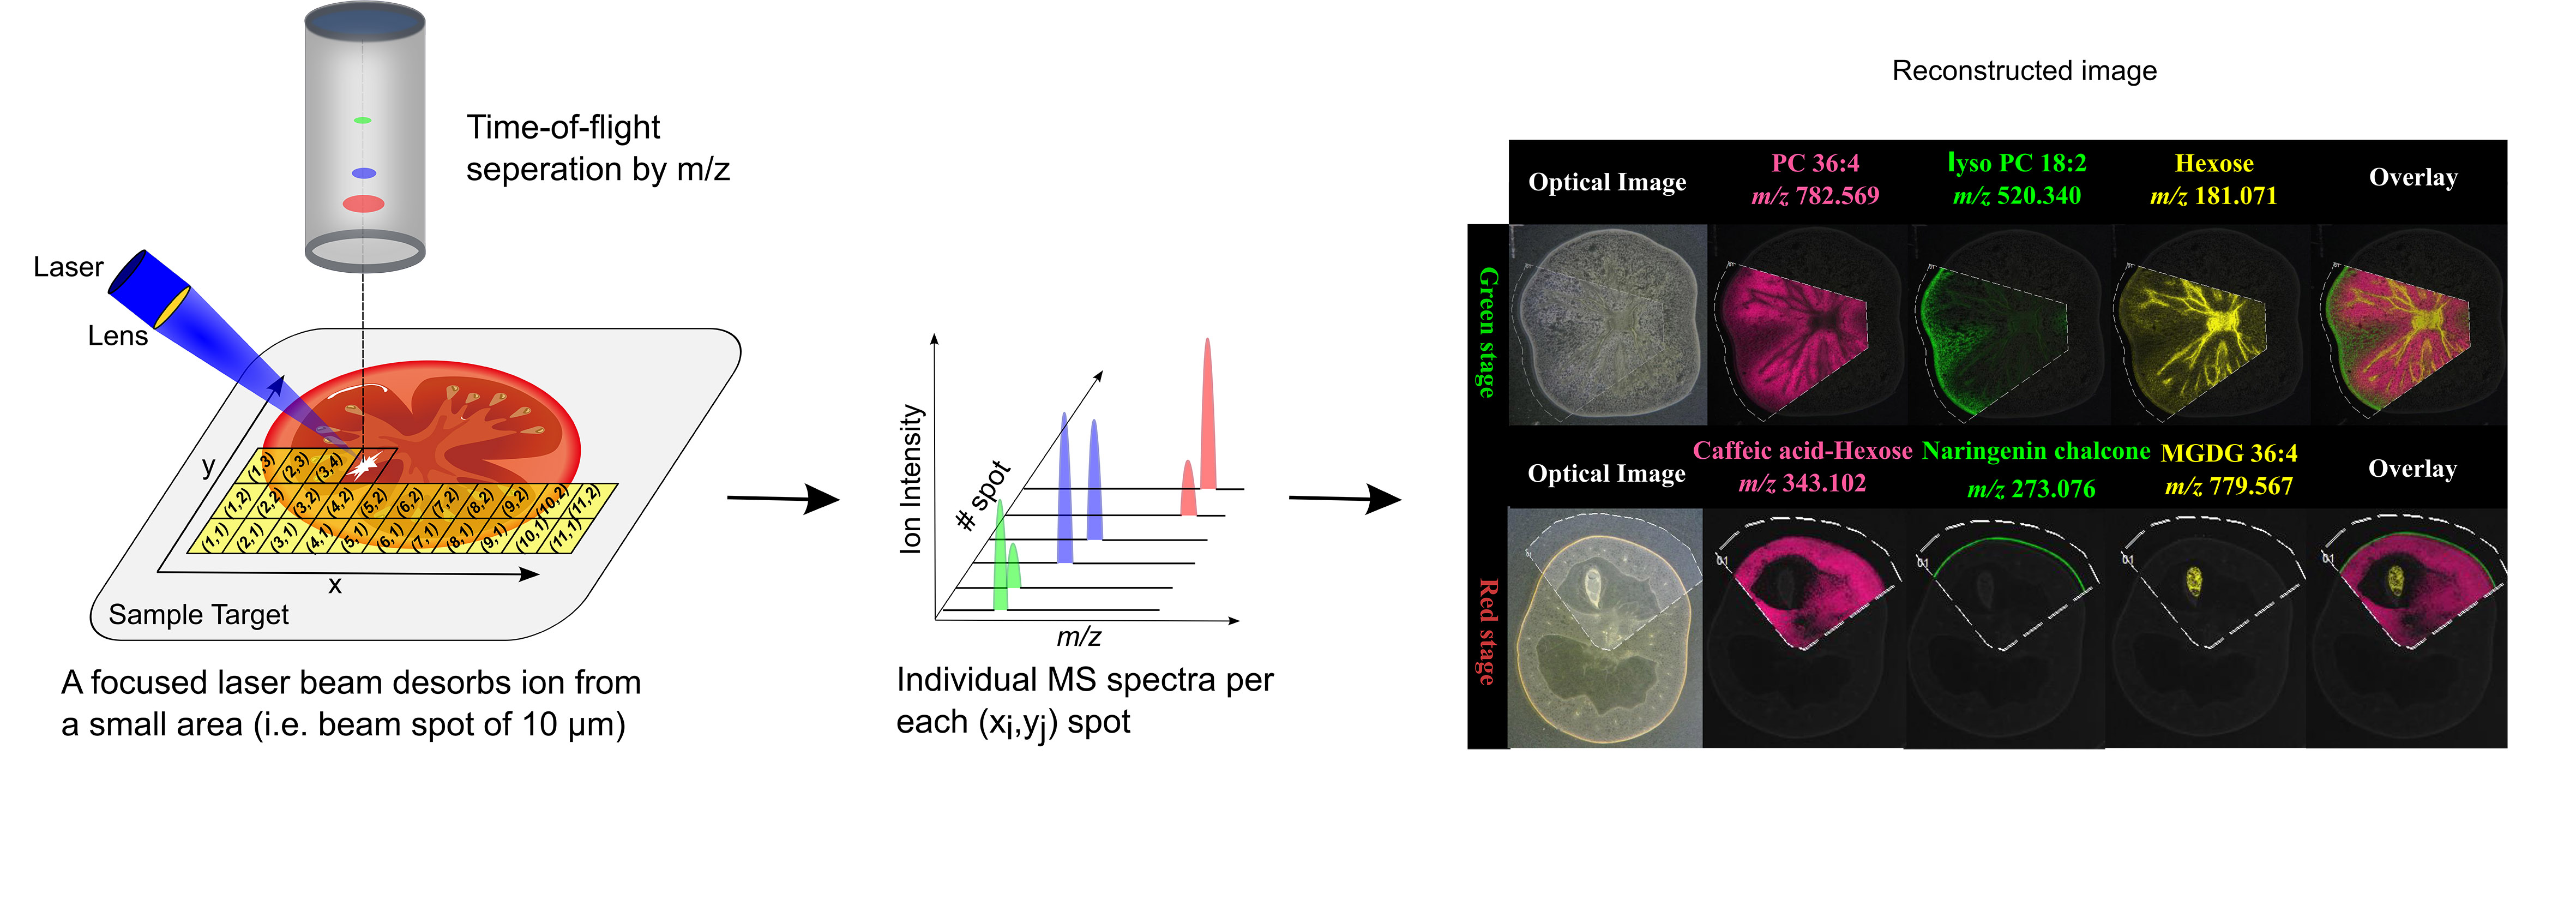
Mass spectrometry imaging (MSI) is a label-free analytical technique that maps the identity, relative abundance, and spatial distribution of molecules directly in biological samples. Unlike histochemical staining, MSI does not require preselected targets, antibodies, or chemical labels. Its ability to combine chemical specificity with intuitive spatial visualization has made it increasingly popular.
The most widely used MSI platforms are matrix-assisted laser desorption/ionization (MALDI), desorption electrospray ionization (DESI), and secondary ion mass spectrometry (SIMS). Although they differ in spatial resolution, chemical coverage, and acquisition speed, all scan a probe across the sample surface while recording a mass spectrum at each location (Fig. 1).
After acquisition, the intensity of a selected m/z value is extracted from each spectrum and displayed as a pseudo-color image. This image shows the spatial distribution of the corresponding ion, which may be assigned to a specific compound. Because an image can be generated for every detected m/z peak, MSI is both untargeted and highly multiplexed, producing tens to thousands of molecular images in a single experiment. These images can also be overlaid or co-registered with optical images for detailed spatial analysis.
1.2 Representative publications
-
Dong, Y., Shachaf, N., Feldberg, L., Rogachev, I., Heinig, U. and Aharoni, A., 2023. PICA: Pixel Intensity Correlation Analysis for Deconvolution and Metabolite Identification in Mass Spectrometry Imaging. Analytical Chemistry, 95(2), pp.1652–1662. PDF
-
Dong, Y., and Aharoni, A., 2022. Image to insight: exploring natural products through mass spectrometry imaging. Natural Product Reports. PDF
-
Dong, Y., Sonawane, P., Cohen, H., Polturak, G., Feldberg, L., Avivi, S.H., Rogachev, I. and Aharoni, A., 2020. High mass resolution, spatial metabolite mapping enhances the current plant gene and pathway discovery toolbox. New Phytologist, 228(6), pp.1986-2002. PDF
-
Dong, Y., Li, B. and Aharoni, A., 2016. More than pictures: when MS imaging meets histology. Trends in Plant Science, 21(8), pp.686-698. PDF
-
Dong, Y., Li, B., Malitsky, S., Rogachev, I., Aharoni, A., Kaftan, F., Svatoš, A. and Franceschi, P., 2016. Sample preparation for mass spectrometry imaging of plant tissues: a review. Frontiers in Plant Science, 7, p.60. PDF
2. Metabolomics
2.1 Introduction
Metabolomics uses analytical techniques to study small molecules, or metabolites, in biological samples. Two main strategies are commonly used:
Untargeted metabolomics aims to detect as many metabolites as possible without requiring prior knowledge of their identities. Results are usually semi-quantitative and reported as relative peak intensities or areas.
Targeted metabolomics measures a defined set of known metabolites, typically using authentic standards to determine their absolute concentrations.
2.2 Representative publications
-
Gou, M., Duan, X., Li, J., Wang, Y., Li, Q., Pang, Y., Dong, Y. (corresponding author), 2022. How do Vampires Suck Blood? PDF
-
Arya, G.C., Dong, Y. (co-first author), Heinig, U., Shahaf, N., Kazachkova, Y., Aviv-Sharon, E., Nomberg, G., Marinov, O., Manasherova, E., Aharoni, A. and Cohen, H., 2022. The metabolic and proteomic repertoires of periderm tissue in skin of the reticulated Sikkim cucumber fruit. Horticulture Research, 9. PDF
3. Stable Isotope Labeling
3.1 Introduction
Stable isotopes have the same number of protons as common elements but differ in neutron number and mass. Consequently, labeled metabolites and their unlabeled counterparts generally behave similarly during liquid chromatography but can be distinguished by mass spectrometry. Stable isotope labeling (SIL) is widely used for metabolite identification, quantification, pathway analysis, and structural elucidation.
In global SIL, isotopes are supplied through major nutrient sources to label most endogenously produced metabolites. In tracer-based SIL, a specific labeled substrate is administered to track its incorporation, metabolic fate, and flux through selected pathways.
3.2 Representative publications
-
Dong, Y., Feldberg, L., Wang, Y., Heinig, U., Rogachev, I., Aharoni, A., 2025. Triple labeling of metabolites for metabolome analysis (TLEMMA): a stable isotope labeling approach for metabolite identification and network reconstruction. The Plant Journal, 123(1), e70333. PDF
-
Dong, Y., Feldberg, L., Aharoni, A., Heinig, U., 2024. Metabolite annotation through stable isotope labeling. TrAC Trends in Analytical Chemistry, 181. PDF
-
Dong, Y., Feldberg, L., Rogachev, I. and Aharoni, A., 2021. Characterization of the PRODUCTION of ANTHOCYANIN PIGMENT 1 Arabidopsis dominant mutant using DLEMMA dual isotope labeling approach. Phytochemistry, 186, p.112740. PDF
-
Dong, Y., Feldberg, L. and Aharoni, A., 2019. Miso: an R package for multiple isotope labeling assisted metabolomics data analysis. Bioinformatics, 35(18), pp.3524-3526. PDF
-
Feldberg, L., Dong, Y. (co-first author), Heinig, U., Rogachev, I. and Aharoni, A., 2018. DLEMMA-MS-imaging for identification of spatially localized metabolites and metabolic network map reconstruction. Analytical Chemistry, 90(17), pp.10231-10238. PDF
4. Chemoinformatics
4.1 Introduction
Both mass spectrometry imaging (MSI) and metabolomics studies generate increasingly complex datasets. Their comprehensive analysis requires specialized and efficient methods from chemoinformatics and statistics.
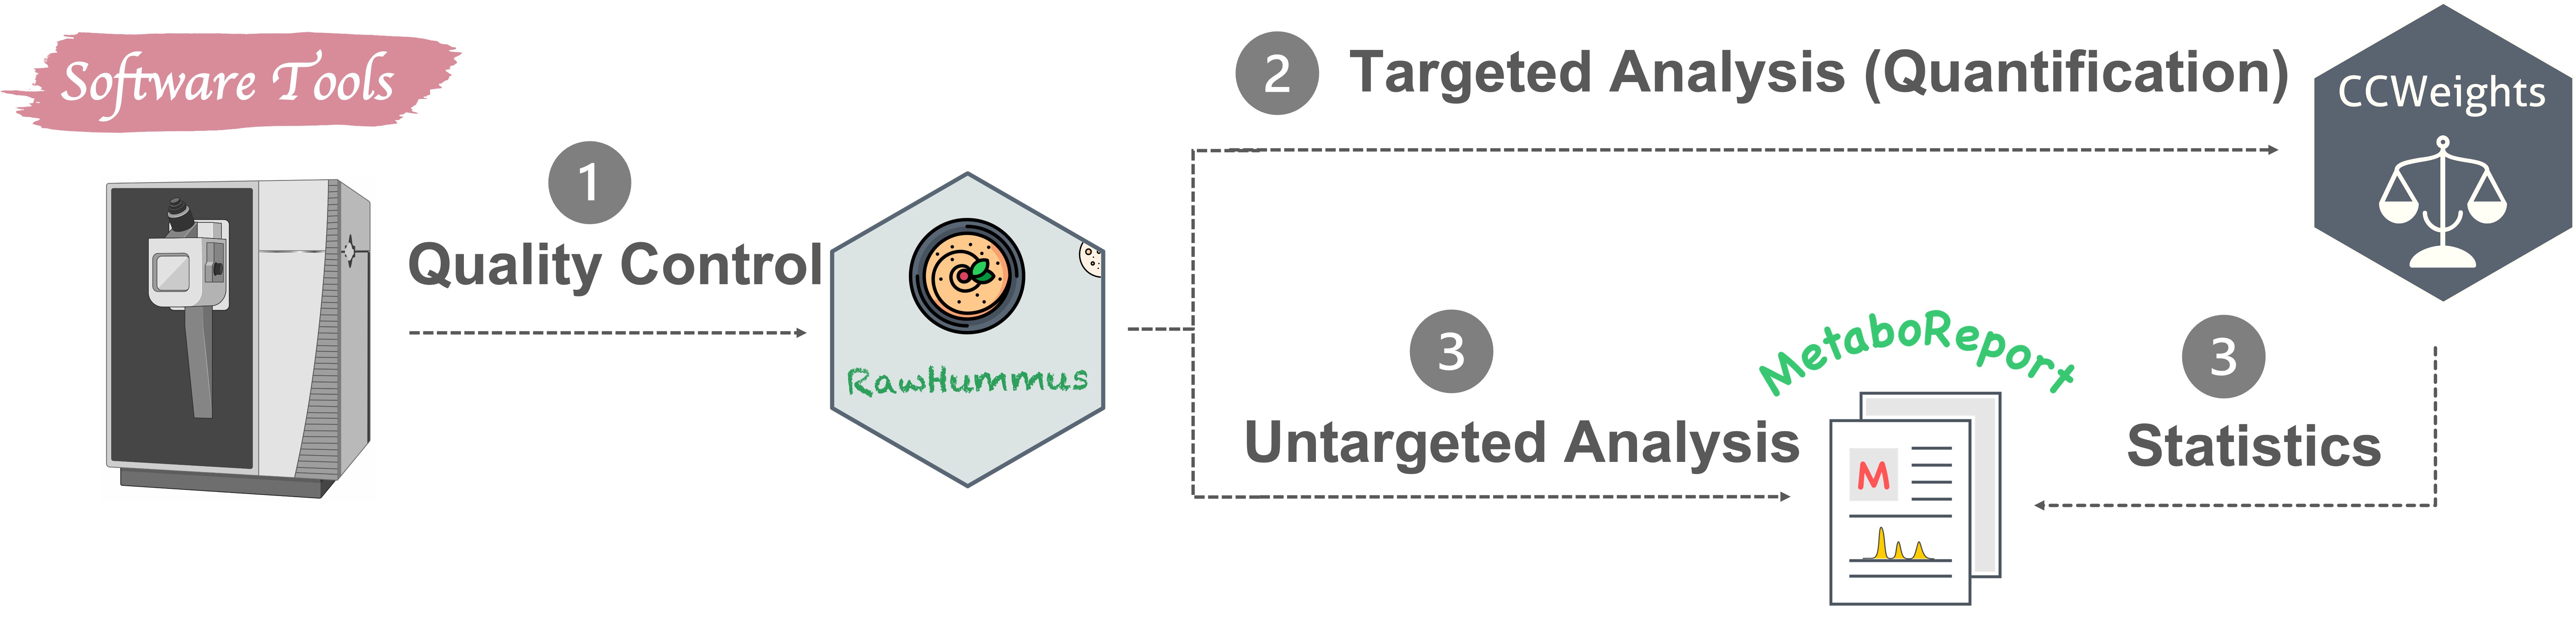
In addition to routine MSI and metabolomics data analysis, I actively develop new analytical methods and software tools for both fields (Fig. 4). I primarily use R and Python.
4.2 Software I have developed
-
MSbox: A collection of general-purpose mass spectrometry tools for checking elemental isotopes; calculating exact monoisotopic masses, m/z values, and mass accuracy, including for isotope-labeled compounds; inspecting potential contaminant peaks; and evaluating common adducts in electrospray ionization (ESI) and matrix-assisted laser desorption/ionization (MALDI). GitHub
-
Miso: An efficient tool for identifying labeled molecules in single-, dual-, or multiple-isotope labeling experiments. GitHub
-
CCWeights: The accuracy of an analytical method depends strongly on the selection of an appropriate calibration model. CCWeights automatically assesses and selects the best weighting factors for accurate metabolite quantification with linear calibration curves. GitHub
-
RawHummus: Reliable and reproducible data are essential for high-quality metabolomics studies because detector sensitivity, retention time, and mass accuracy can drift during acquisition. RawHummus automatically detects measurement bias and evaluates system consistency. GitHub
-
MetaboReport: A flexible and user-friendly workflow for data cleaning, preprocessing, statistical analysis, and reporting in metabolomics, lipidomics, and proteomics. (Under development.)
4.3 Representative publications
-
Dong, Y., Kazachkova, Y., Gou, M., Morgan, L., Wachsman, T., Gazit, E. and Birkler, R.I.D., 2022. RawHummus: an R Shiny app for automated raw data quality control in metabolomics. Bioinformatics, 38(7), pp.2072-2074. PDF
-
Dong, Y., Wachsman, T., Morgan, L., Gazit, E. and Birkler, R.I.D., 2021. CCWeights: an R package and web application for automated evaluation and selection of weighting factors for accurate quantification using linear calibration curve. Bioinformatics Advances, 1(1), p.vbab029. PDF
-
Dong, Y., Feldberg, L. and Aharoni, A., 2019. Miso: an R package for multiple isotope labeling assisted metabolomics data analysis. Bioinformatics, 35(18), pp.3524-3526. PDF